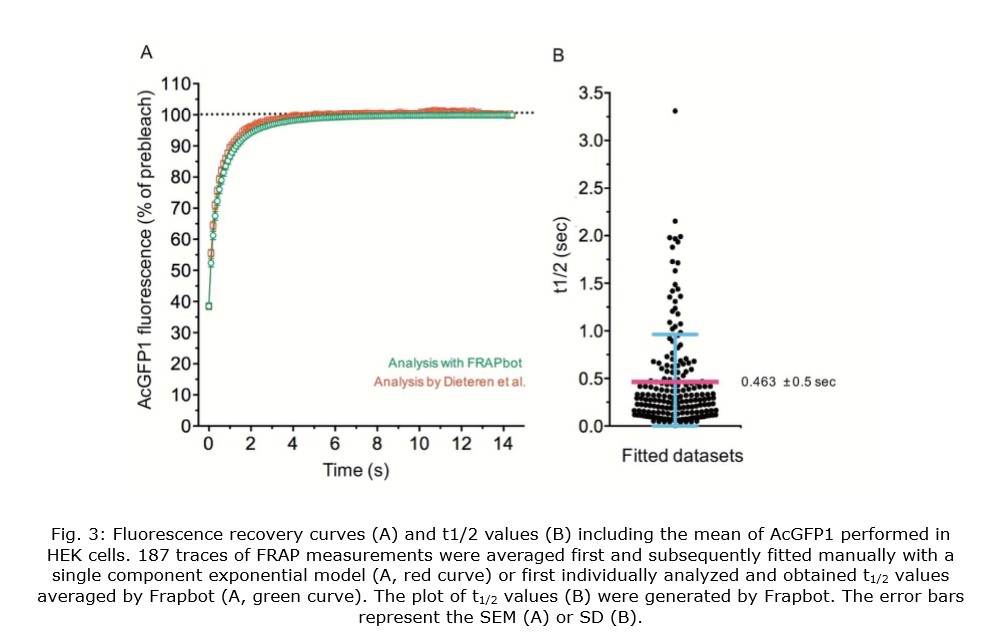
Dieteren et al., PNAS, 2011
We benchmarked Frapbot using a previously published FRAP dataset obtained with inducible human embryonal kidney (HEK293) cells that expressed a monomeric green fluorescent protein (AcGFP1) in the mitochondrial matrix (Dieteren et al., PNAS, 2011). In the original study, the average trace of multiple FRAP measurements (n=187) was manually fitted with a single component exponential model by Origin Pro software, delivering a τmono value of 0.600 s, corresponding to a t1/2 of 0.416 s. Individual analysis of the identical FRAP traces by Frapbot (Fig. 3, A) and subsequent averaging of the obtained t1/2 values, delivered a slightly higher mean halftime (t1/2) of 0.463 s (Fig. 3, B). This difference might be explained by the larger noise of the individual traces compared to the averaged FRAP curve, that influences the quality of the fitting. Frapbot analysis suggests that the t1/2 values of the dataset were not Gaussian distributed. If this is the case, we recommend the use of the median instead of the average for the analysis of similar future FRAP data which provides more robustness against outliers. Consequently, the calculation of the median was implemented in Frapbot.
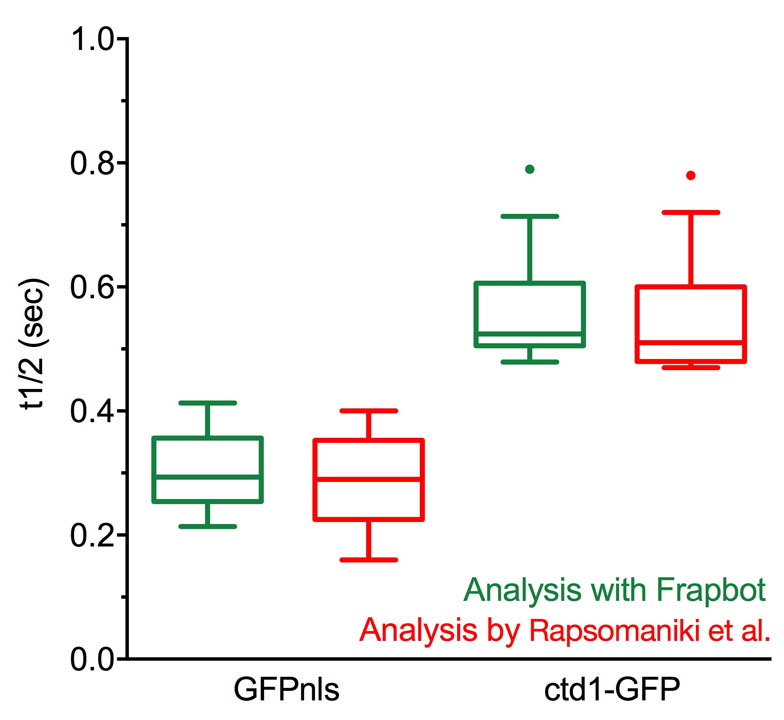
Rapsomaniki et al., Bioinformatics 2012
The comparable analysis of datasets was extended to include mobility measurements of the Chromatin Licensing and DNA Replication Factor 1 (Ctd1), which is involved in the formation of the pre-replication complex (preRC) during G1 phase of a cell cycle. Ctd1 has been shown to be crucial for determining when the selection of the origin of replication (licensing process) occurs to restrict this process exclusively to the G1 phase and thereby maintain the accurate DNA replication during the subsequent S phase (Wohlschlegel et al., Science, 2000, Nishitani et al., J Biol Chem, 2001). Thus, a fundamental understanding of the spatiotemporal coordination of Ctd1 to ensure that the right origins are used at the correct point in time are pivotal. Rapsomaniki et al. analysed the mobility of Ctd1 using the datasets of Ctd1-GFP (n=15) in comparison with nuclear localized construct of GFP (GFPnls, n=12) and calculated t1/2 values of 0.548 +/- 0.06 sec for Ctd1-GFP and 0.281 +/- 0.5 sec for GFPnls (Rapsomaniki et al, Bioinformatics, 2012) that are similar to our calculated values of 0.558 +/- 0.05 s for Ctd1-GFP and 0.305 +/- 0.04 s for GFPnls using double exponential fitting in Frapbot.